outlier Metrics Operator
The metrics outlier operator identifies metrics data points that are outside the range of expected values. Outliers help you spot unusual behavior in your metrics visualizations and track the behavior over time.
outlier tracks the moving average and standard deviation of a time series over a specified time window, and calculates a threshold band, outside of which data points are considered outliers. You can use optional qualifiers to specify the time window, the number of standard deviations beyond which a data point is considered an outlier, and the directionality of the deviation.
You cannot directly reference the outlier operator in a metrics monitor, however, you can use the outlier detection method in a metrics monitor to alert based on outlier events.
Syntax
outlier [window=<time_unit_or_number>, threshold=<number>, direction=[ +- | + | - ]]
Where:
windowis the range over which to calculate the moving average and standard deviation of the time series.windowcan be specified with time units (s, m, h), or it can be specified without time units. Default: 5m.thresholdis the number of standard deviations from the moving average that defines the threshold band. Default: 3directionspecifies what deviation direction should trigger violations: positive deviations (+), negative deviations (-), or both (+-). Default:+-.
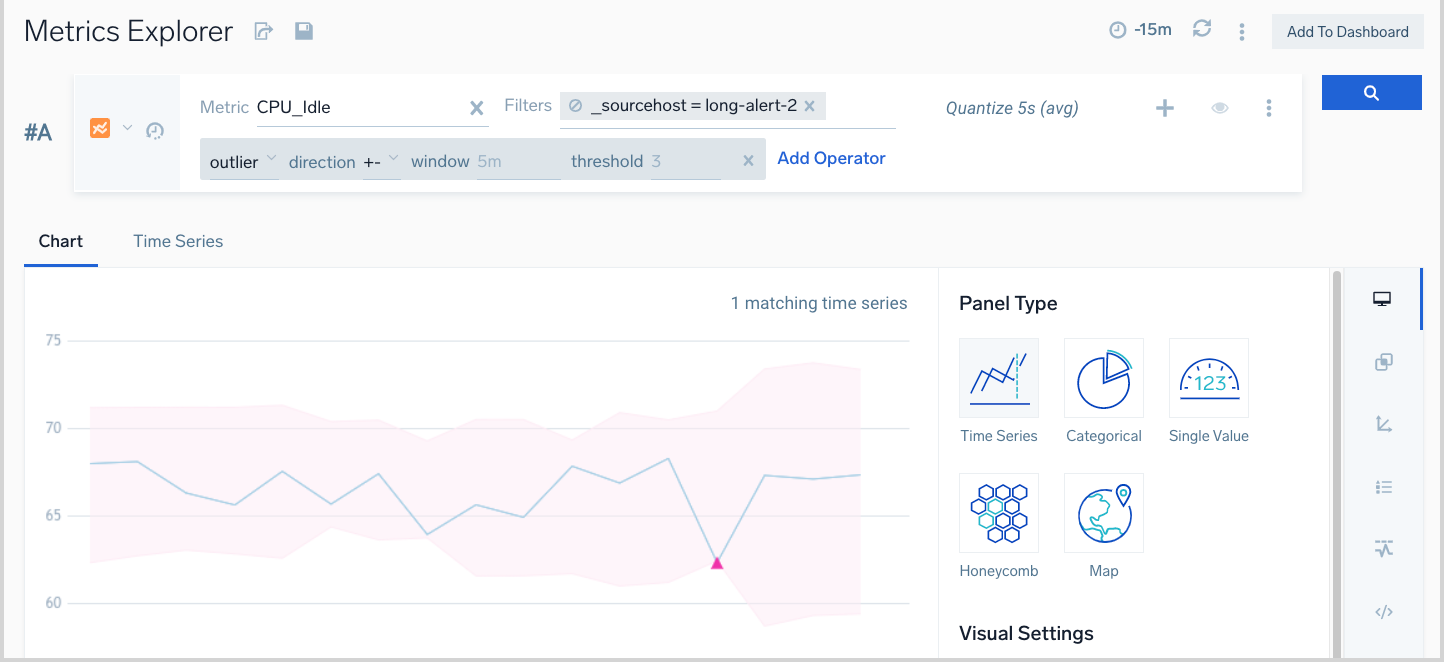
In the visualization, the threshold band is the part shaded in pink. The outlier values are represented by the pink triangles.